The relation between optical polarization and reddening in the general interstellar medium
Our study focused on the polarization efficiency of optical starlight as it travels through the dusty, magnetized interstellar medium (ISM). Polarization efficiency, denoted as PV/E(B−V), measures the fraction of polarization intensity per unit of reddening and is influenced by the properties of interstellar dust grains and the magnetic field.
Polarization efficiency is a crucial measure related to dust grain alignment and magnetic field properties. The maximum observed value, [PV/E(B−V)]max, is indicative of optimal ISM polarizing conditions. Infrared observations by the Planck satellite established the maximum value at 13% mag-1. However, recent optical observations in highly polarized regions of the Galaxy suggested higher values between 13.6% mag-1 and 18.2% mag-1, implying that [PV/E(B−V)]max is not well constrained.
Using V-band polarimetry from the Interstellar Polarization Survey--General Interstellar Medium (IPS-GI) catalog, which includes about 10,500 observations, we estimated the upper limit of the polarization efficiency at the weighted 99th percentile in various fields. In five regions, this upper limit exceeded 13% mag-1. We found a revised [PV/E(B−V)]max of 15.8% mag-1 in diffuse intermediate-latitude regions with a strong regular Galactic magnetic field in the plane-of-sky.
The research also examined the variations of the maximum polarization efficiency across the sky (see figure below) and tested models that align with a uniform spiral magnetic field, indicating some correspondence.
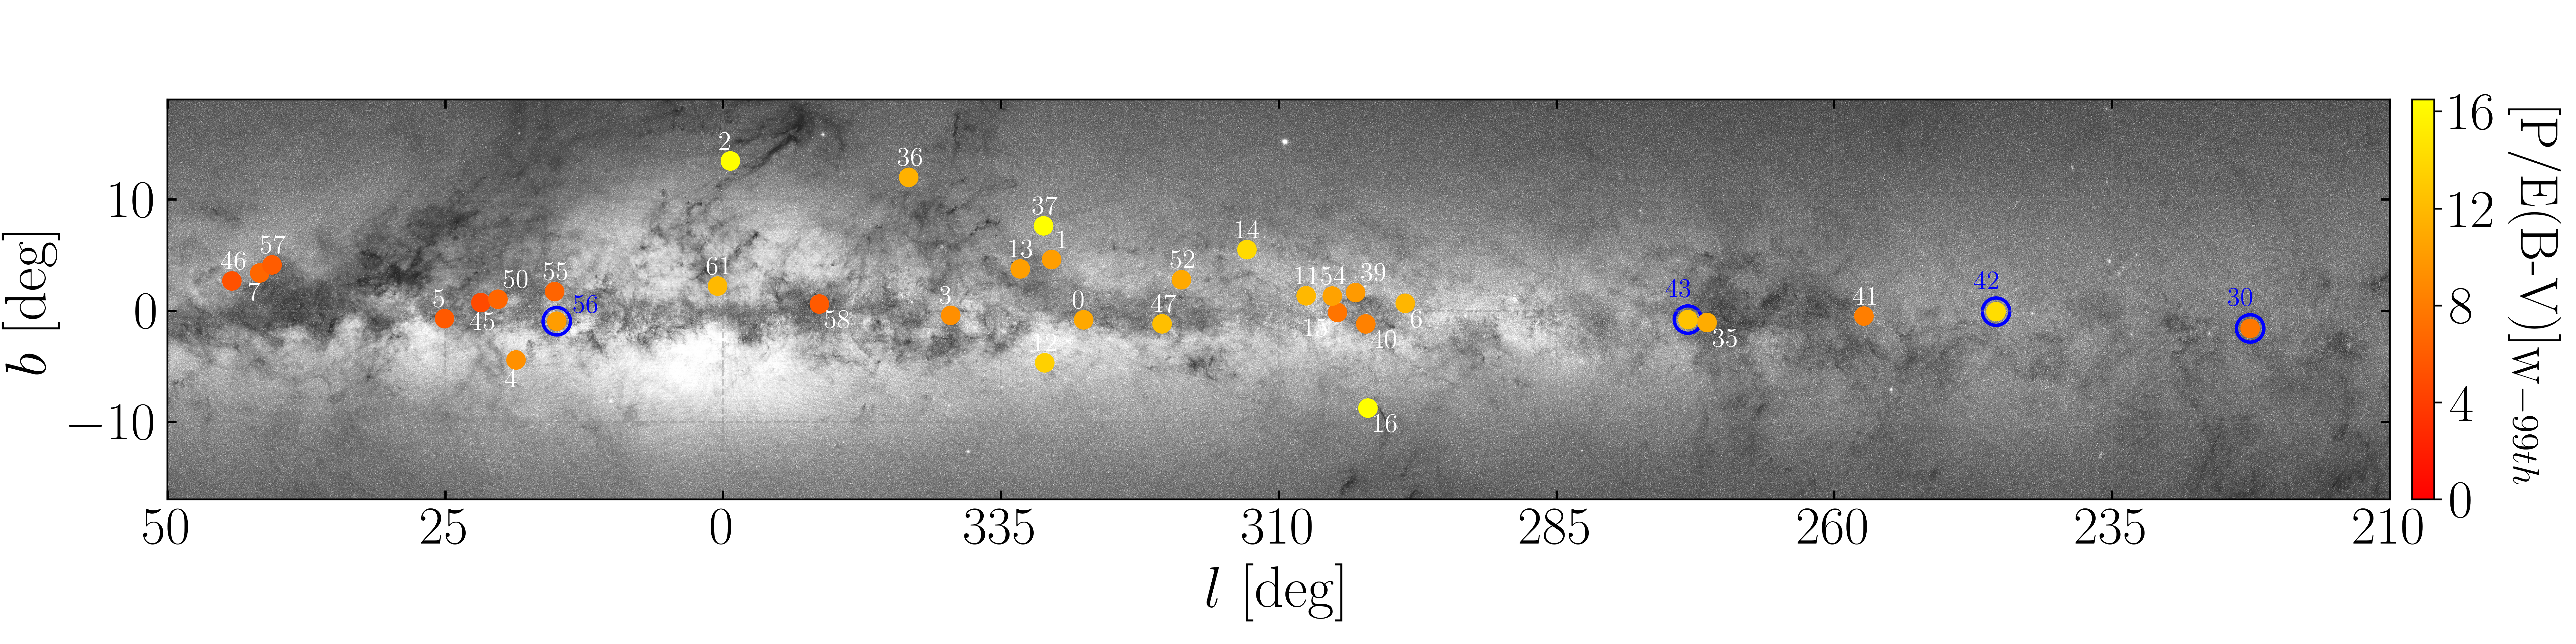
Figure: Sky plot showing the IPS-GI fields location colored by the weighted PV/E(B−V) upper limits. The blue circles are unreliable upper limits due to potential outliers. The background image is the optical emission of the Galaxy adapted from ESA/Gaia/DPAC.
Characterizing the Magnetic Field Strength and Turbulent Dispersion Using Optical Starlight Polarization in the Diffuse Interstellar Medium
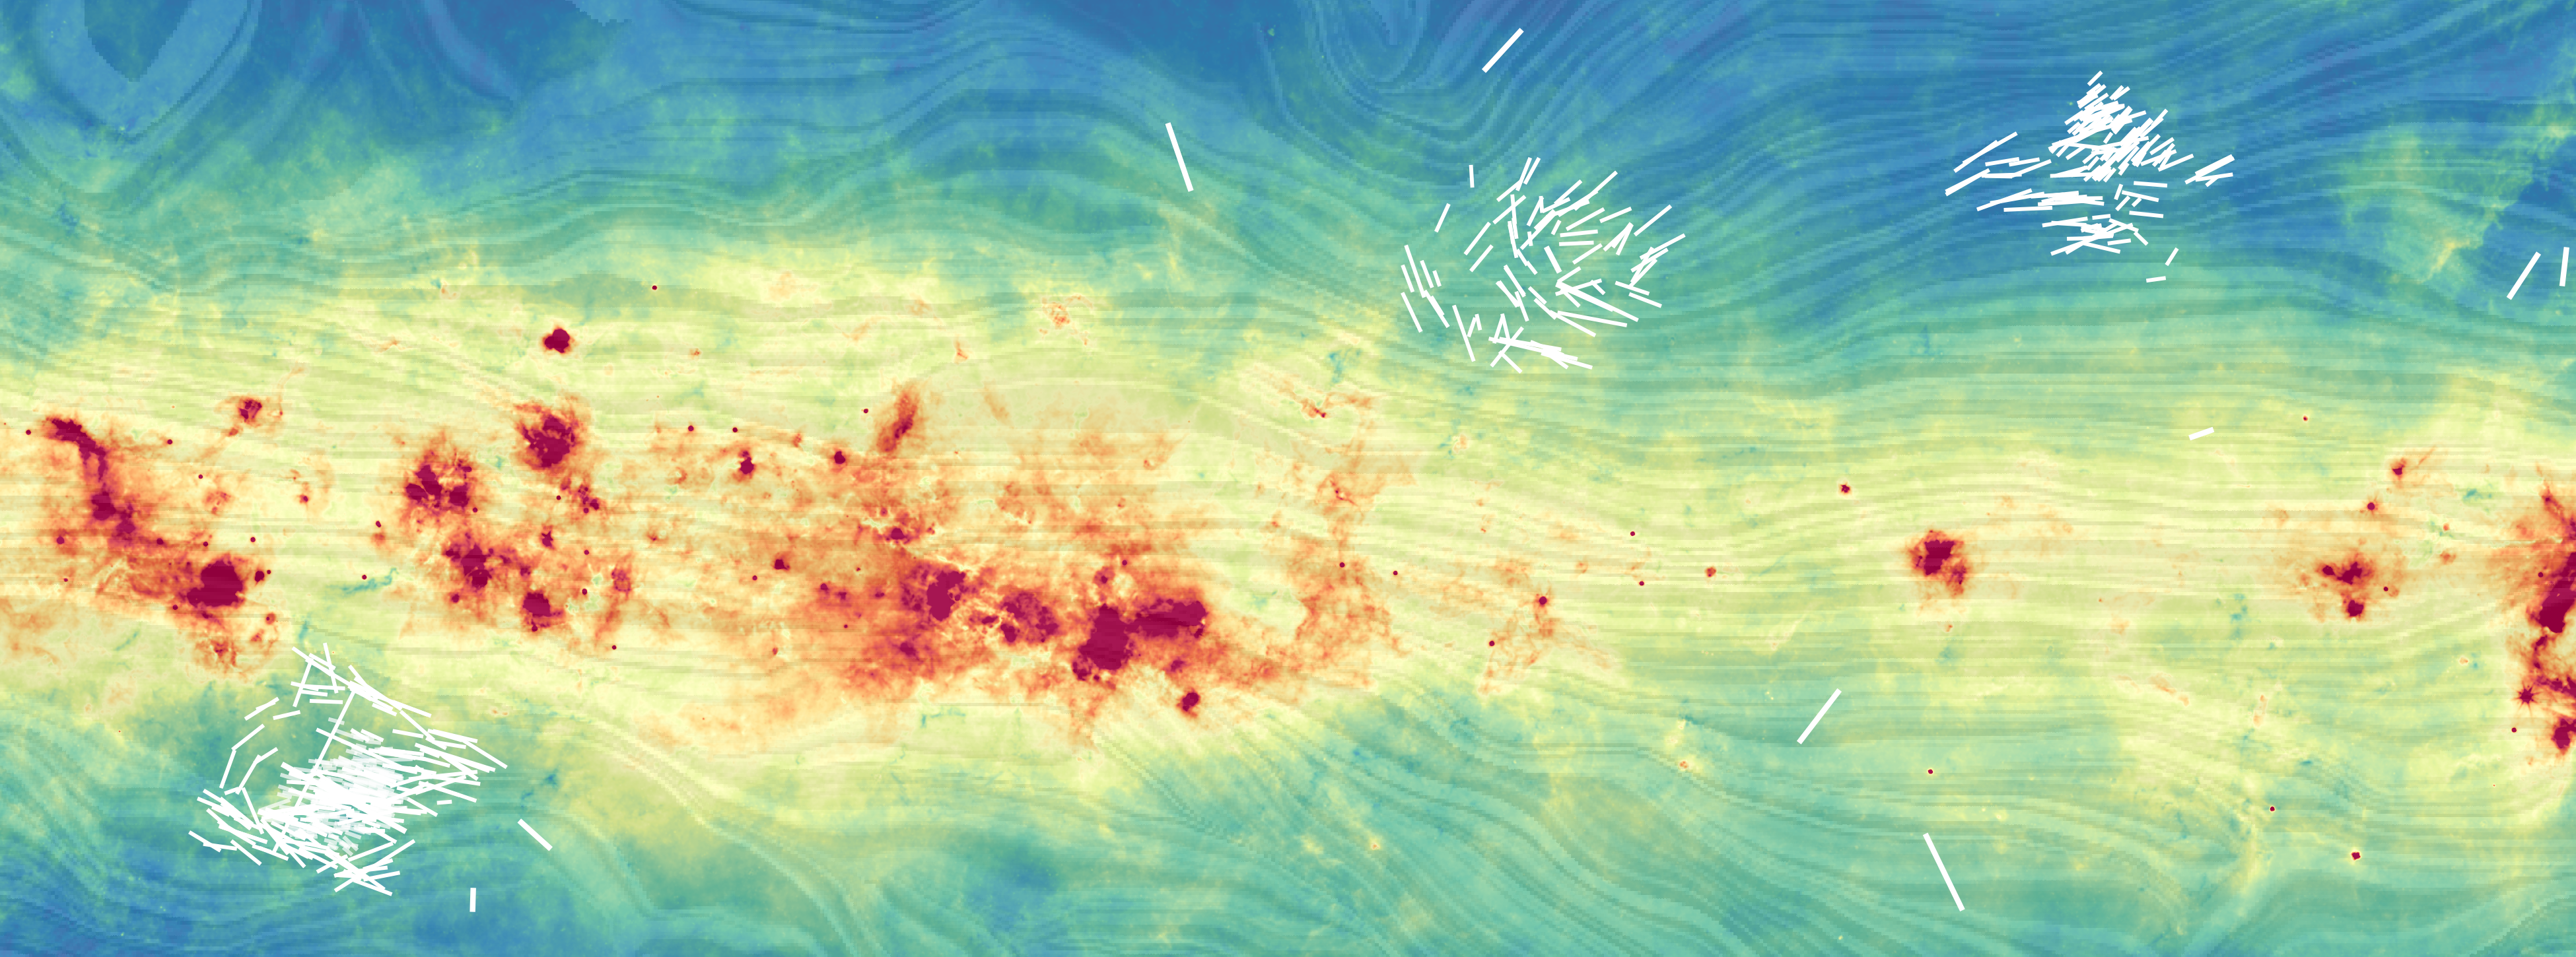
In this study, we used angular dispersion functions (ADF) to estimate fluctuations in polarization angles around the mean magnetic field orientation in low-density regions of the nearby interstellar medium (ISM). Additionally, we determined the magnetic field strength of the dusty nearby structures.
ADF is used to assess the turbulent-to-regular magnetic field ratio (〈Bt〉1/2/Bpos) in dense regions like molecular clouds. This method provides more accurate estimates than the classic Davis–Chandrasekhar–Fermi (DCF) method. Our study explored the applicability of ADF in characterizing the magnetic field in low-density ISM regions, particularly when the turbulence outer scale (δ) is smaller than the smallest observed scale (ℓmin).
Optical polarization maps of three intermediate-latitude regions (|b| > 7.∘5) from the Interstellar Polarization Survey--General Interstellar Medium (IPS-GI) catalog were used (see the polarization as a function of distance in Figure 1). We decomposed HI emission data to estimate the mass density (ρ), turbulent velocity dispersion (σv,turb), and ultimately the magnetic field strength (Bpos) within these fields.
In regions with well-defined structures within 400 pc, Bpos ranges from approximately 3 μG to 9 μG (Figure 2). For regions where structures extend up to 1000 pc, Bpos varies from about 1 μG to 3 μG, consistent with previous estimates in the diffuse ISM.
Both optical starlight polarization and thermal dust polarization at 353 GHz reveal a highly regular plane-of-sky magnetic field orientation, unaffected by diffuse dust structures observed at 12 μm.
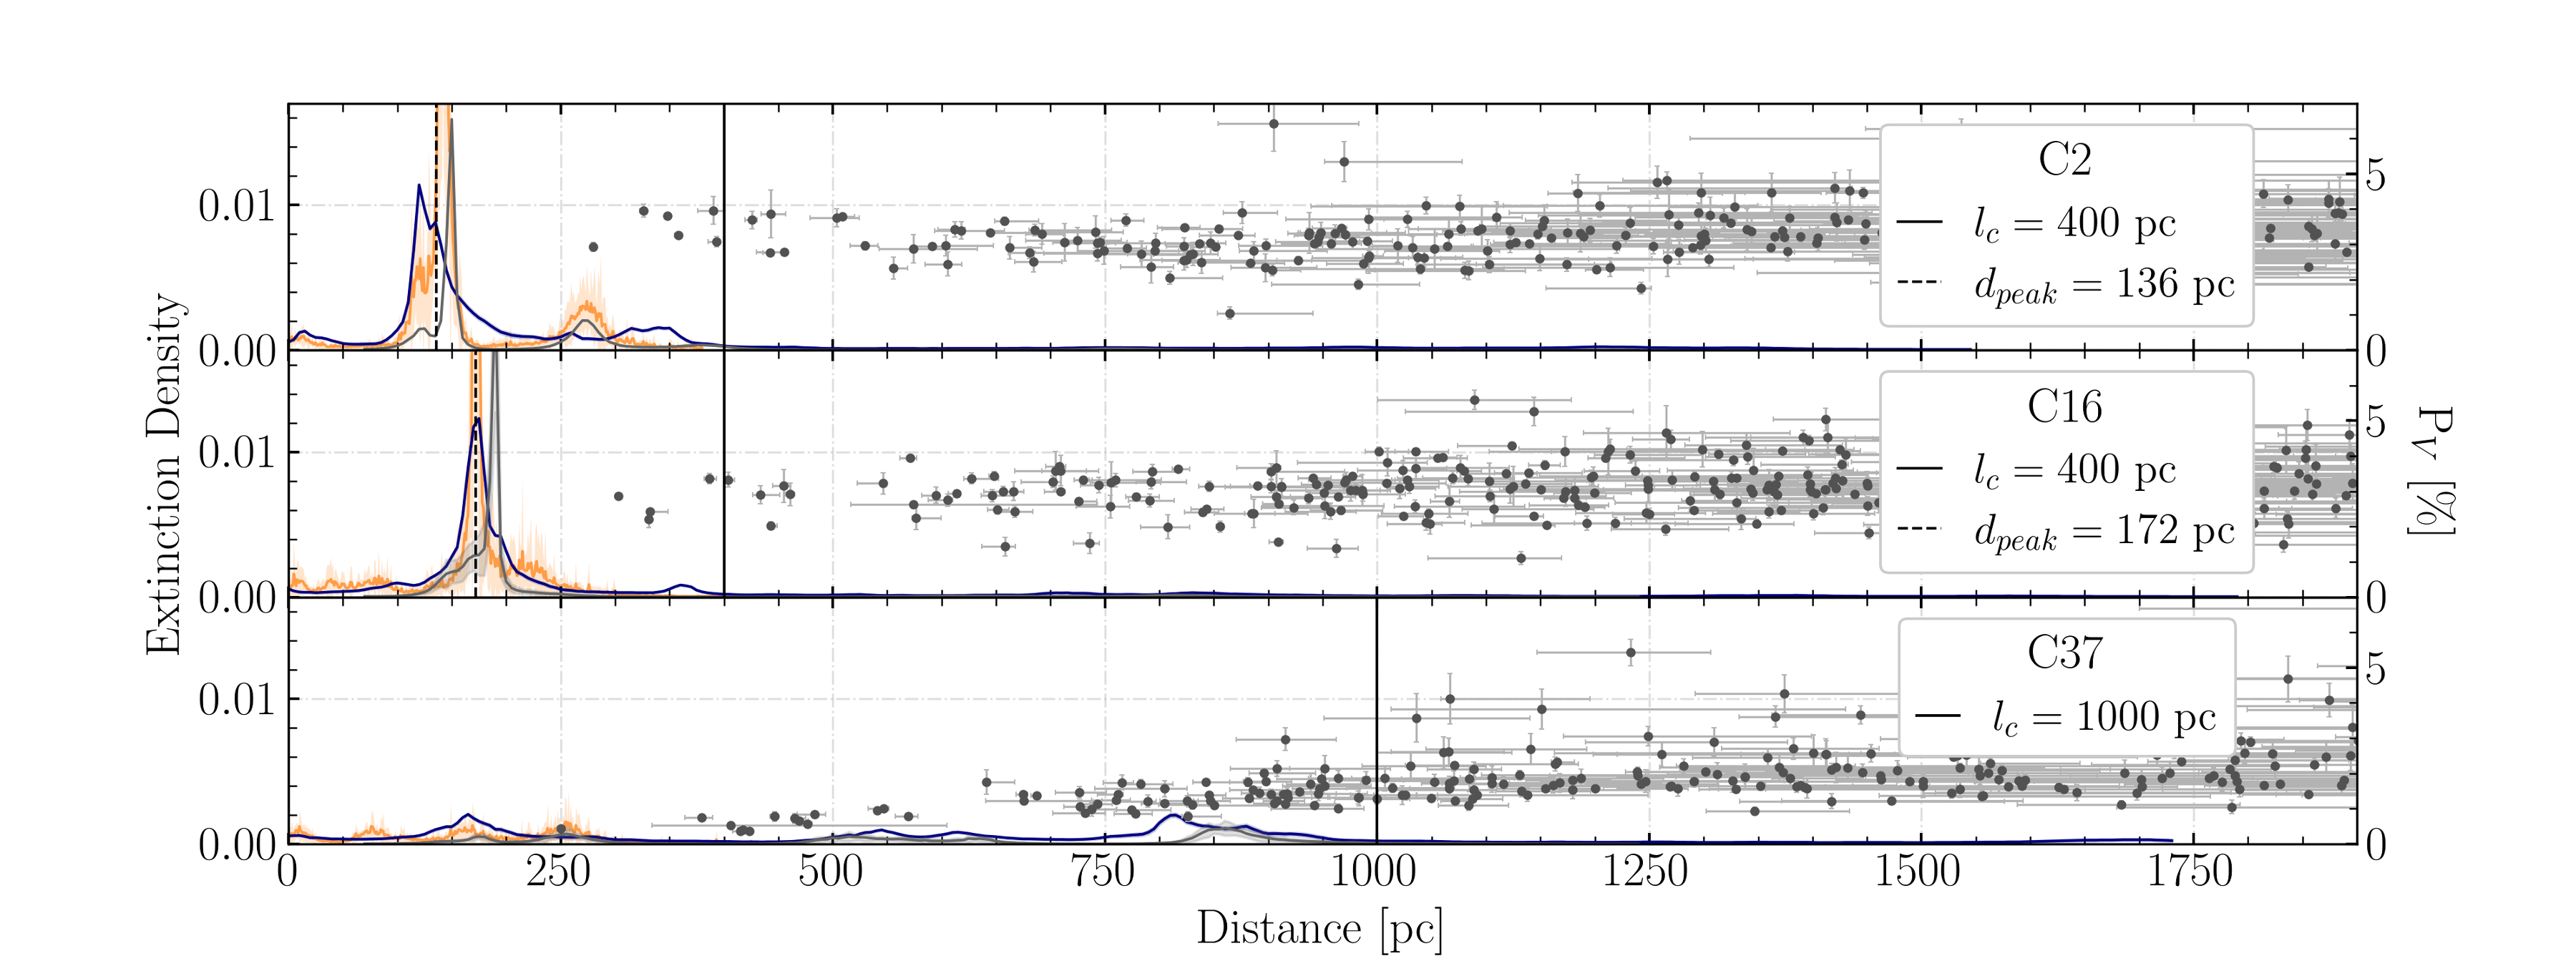
Figure 1: Extinction density as a function of the distance from Vergely et al. (2022, the blue solid line), Leike et al. (2020, the orange solid line), and Edenhofer et al. (2023, the gray solid line) in the direction of C2 (top), C16 (middle), and C37 (bottom). The gray dots show the IPS-GI optical polarization as a function of the distance. The vertical black dashed lines show the distance to the dust peaks.
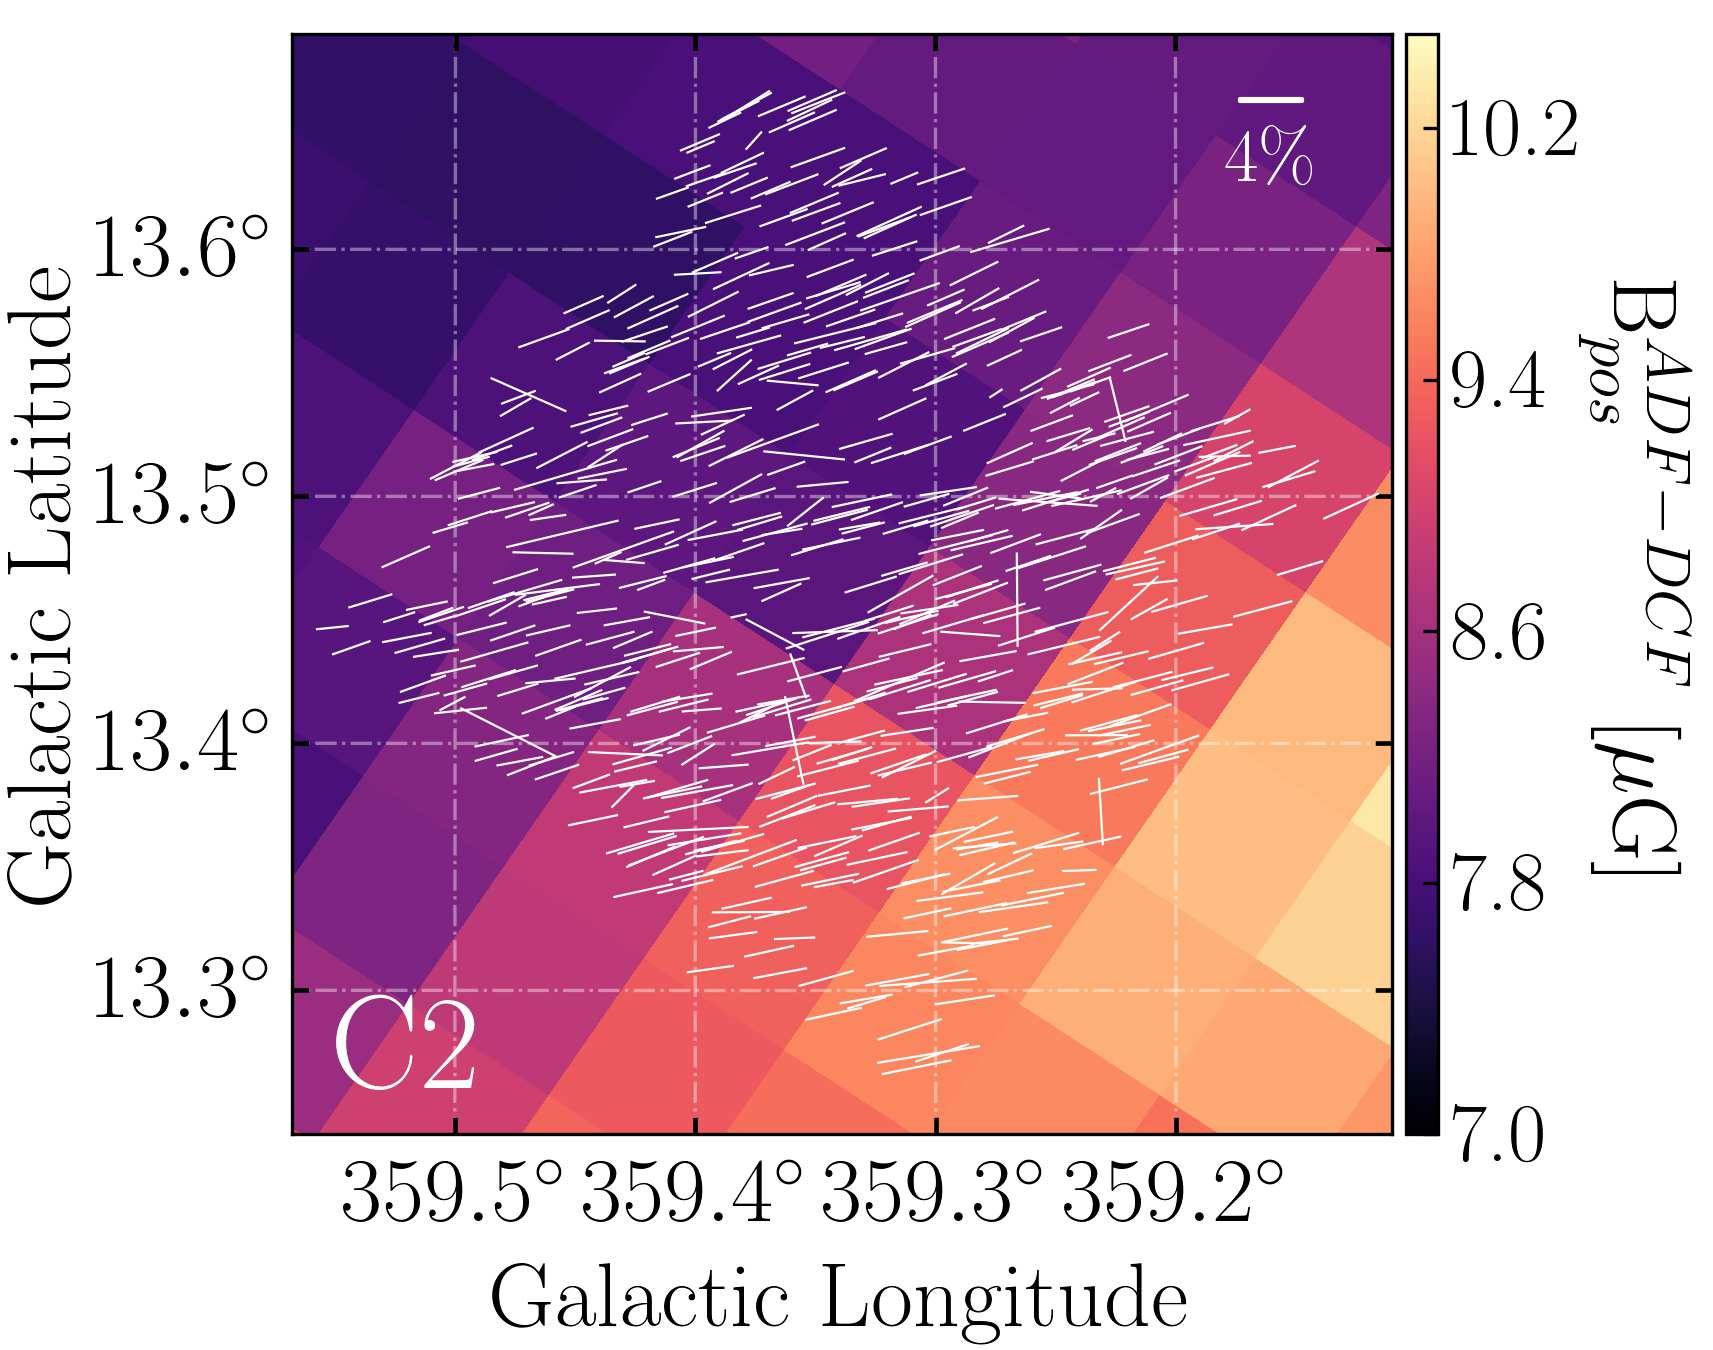
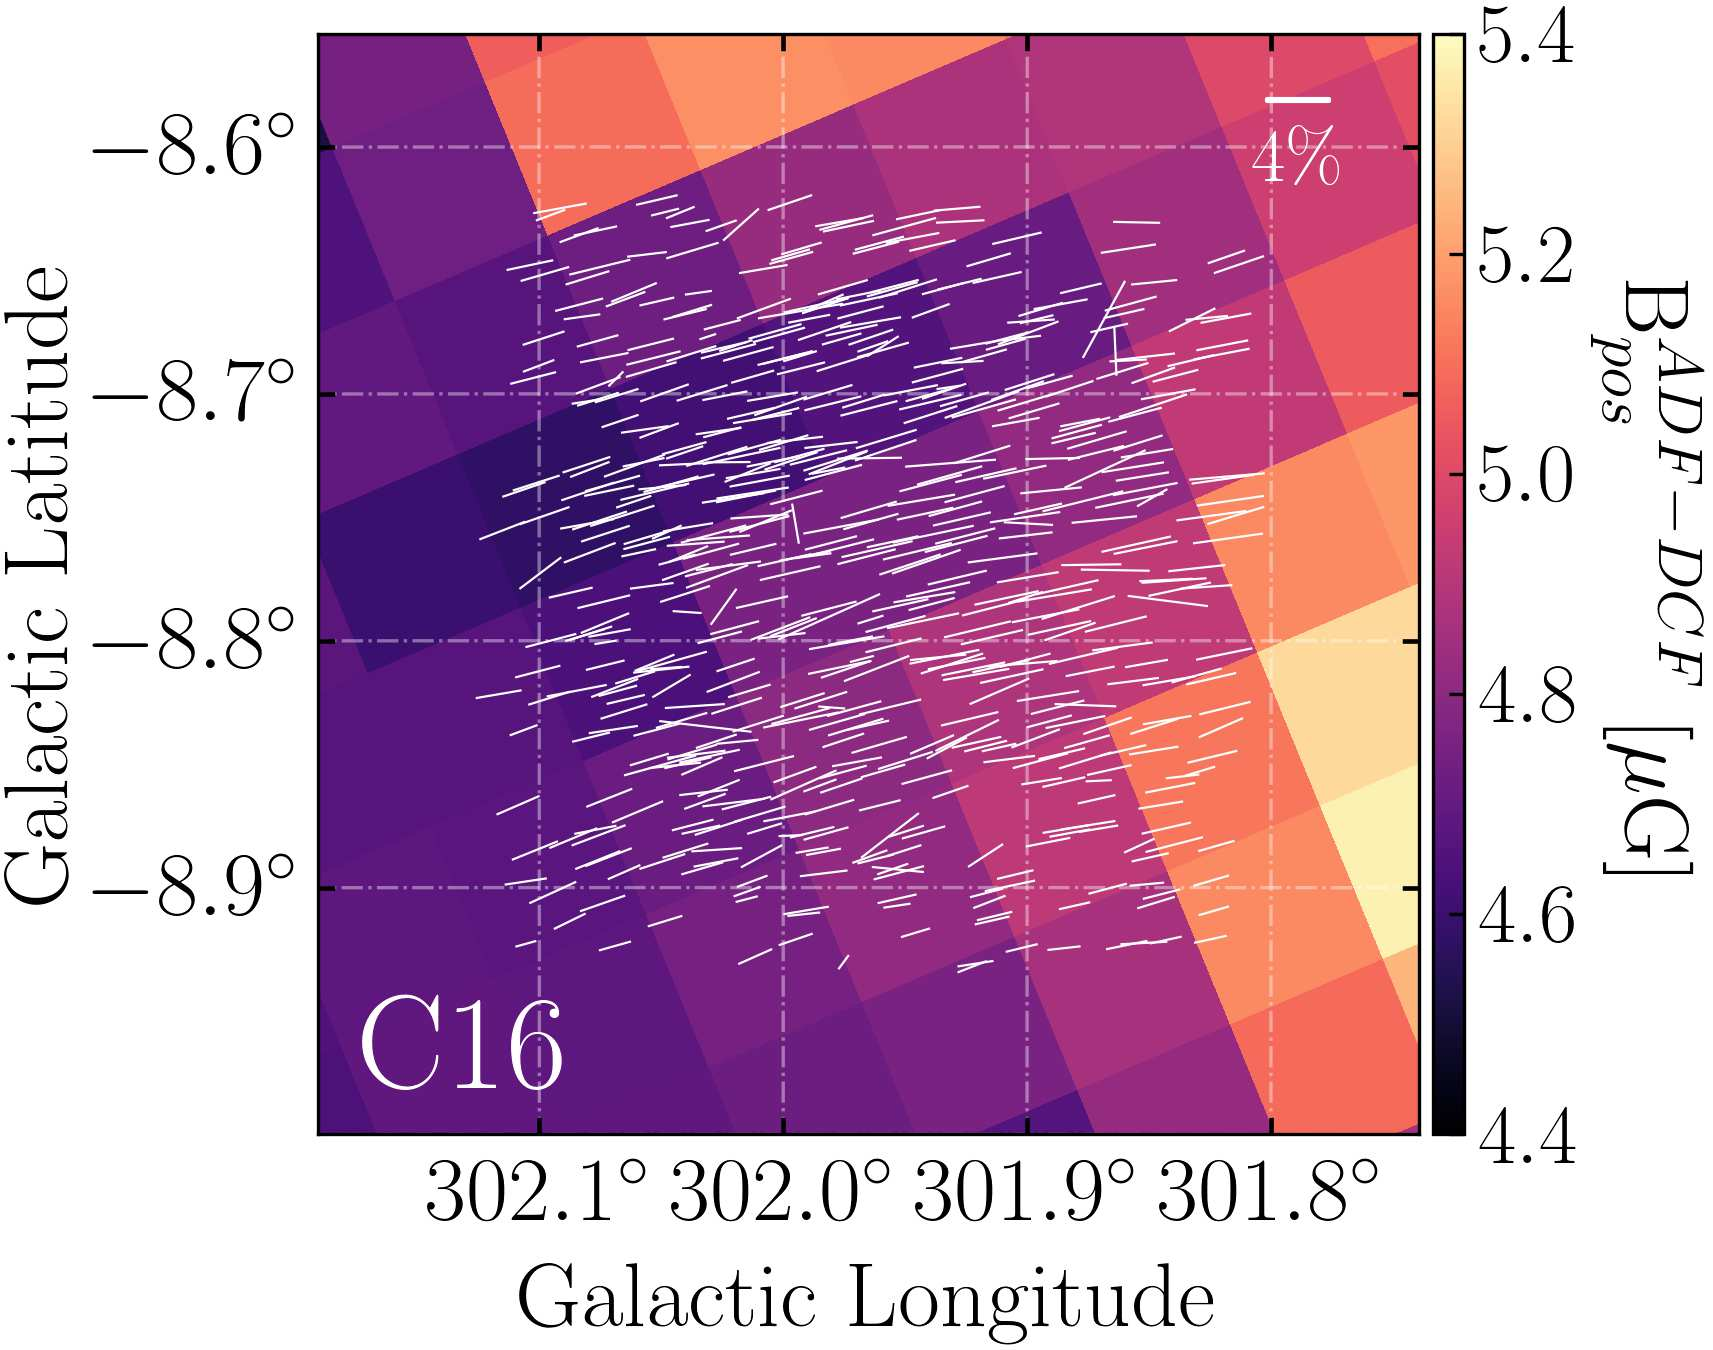
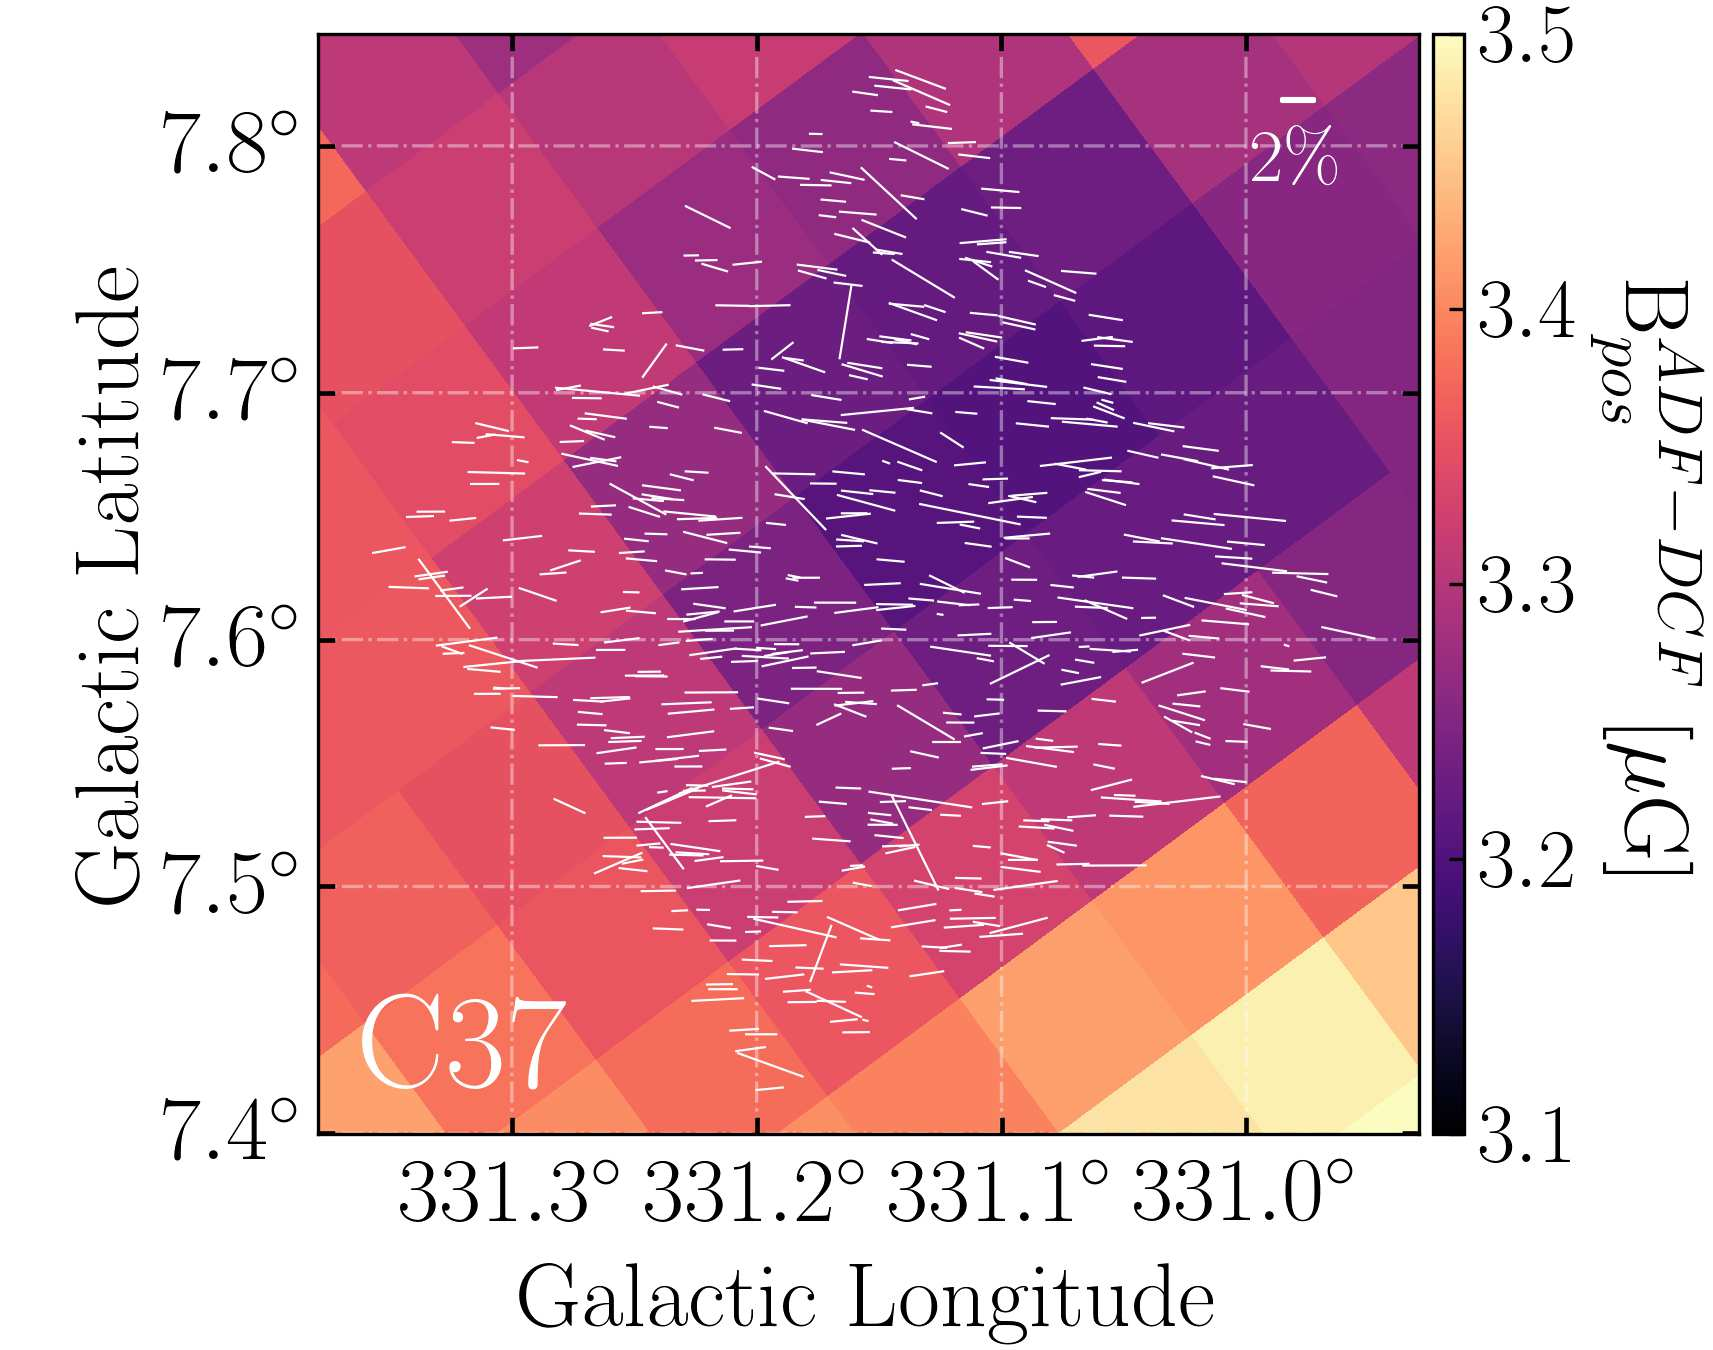
Figure 2: Magnetic field strength maps in the regions C2 (left), C16 (middle), and C37 (right). The white pseudo-vectors represent the IPS-GI starlight polarization.
Galactic magnetic field tomography in the spiral arms using optical and near-infrared starlight polarization
This research focused on understanding the contributions of various magnetized dust structures along the line of sight (LOS) and how they shape the observed polarization. In other words, we analyzed how different magnetized dust structures contribute to the overall polarization observed from Earth. To this end, we combined polarization measurements with stellar distances to perform a tomographic analysis of the Galactic magnetic field (GMF) across different interstellar dusty structures.
We used Bayesian Inference of Starlight Polarization (BISP-1) and Gaussian Mixture Model (GMM) methods to analyze optical and near-infrared (NIR) polarization data from three regions in the Galactic plane (|b| < 1sup>∘). We identified polarizing clouds at various distances: nearby (≤143 pc), intermediate (0.47–1.2 kpc), and distant (1.5–2.5 kpc). These clouds align with known structures in the Local Bubble, Local arm, and Sagittarius arm.
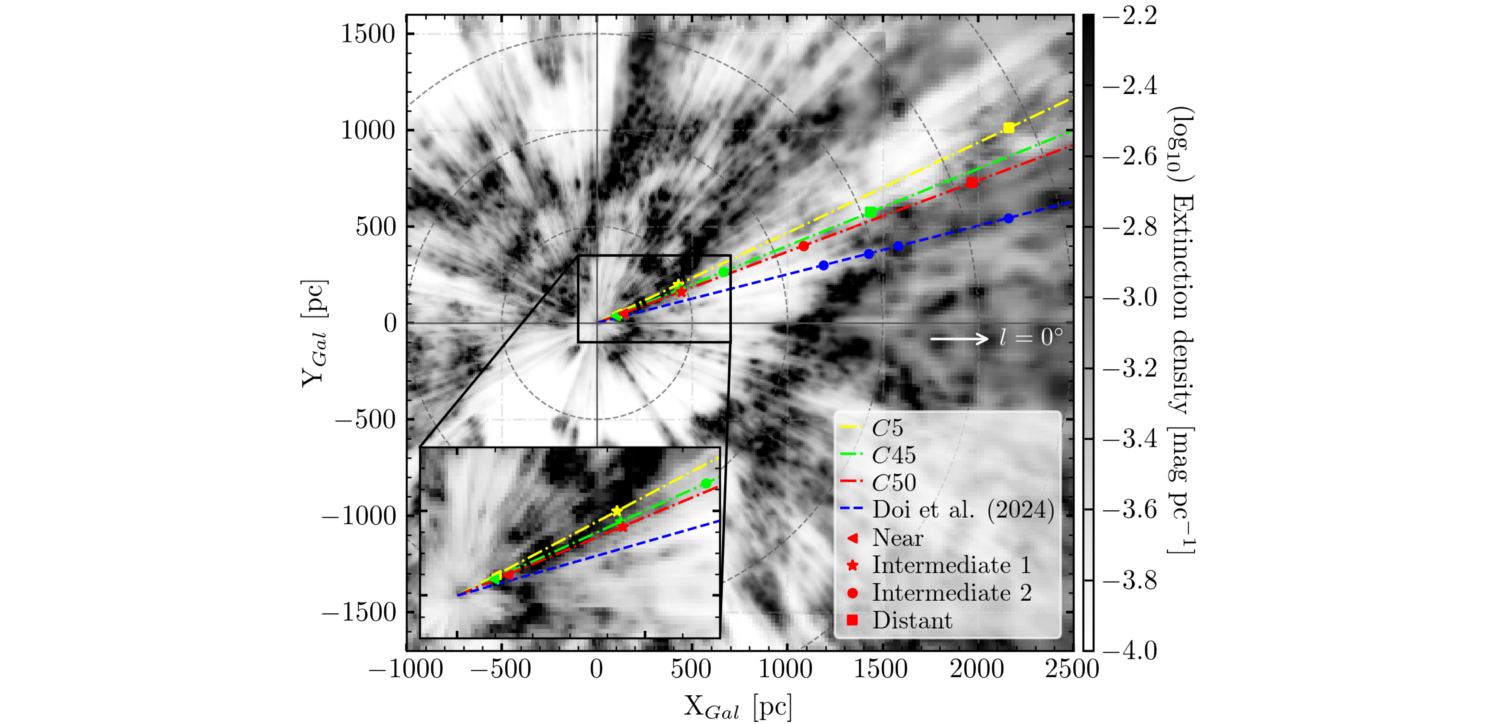
Figure 1: Lines of sight of C5 (in yellow), C45 (in green), and C50 (in red) drawn on top of the face-on 3D dust maps from Vergely et al. (2022). The markers point out the corrected position of the clouds found with optical polarization decomposition. The results of Doi et al. (2024) in the Sagittarius arm are also displayed (in blue) for comparison.
Both optical and NIR polarization measurements are found to be complementary, tracing similar GMF properties across different regions. Furthermore, we provided LOS-integrated polarization degrees and orientations for the stars behind each polarizing cloud. The GMF orientation in the Sagittarius arm, as observed through starlight polarization, matches closely with the average orientation observed by the Planck satellite at 353 GHz in at least two of the three regions studied.
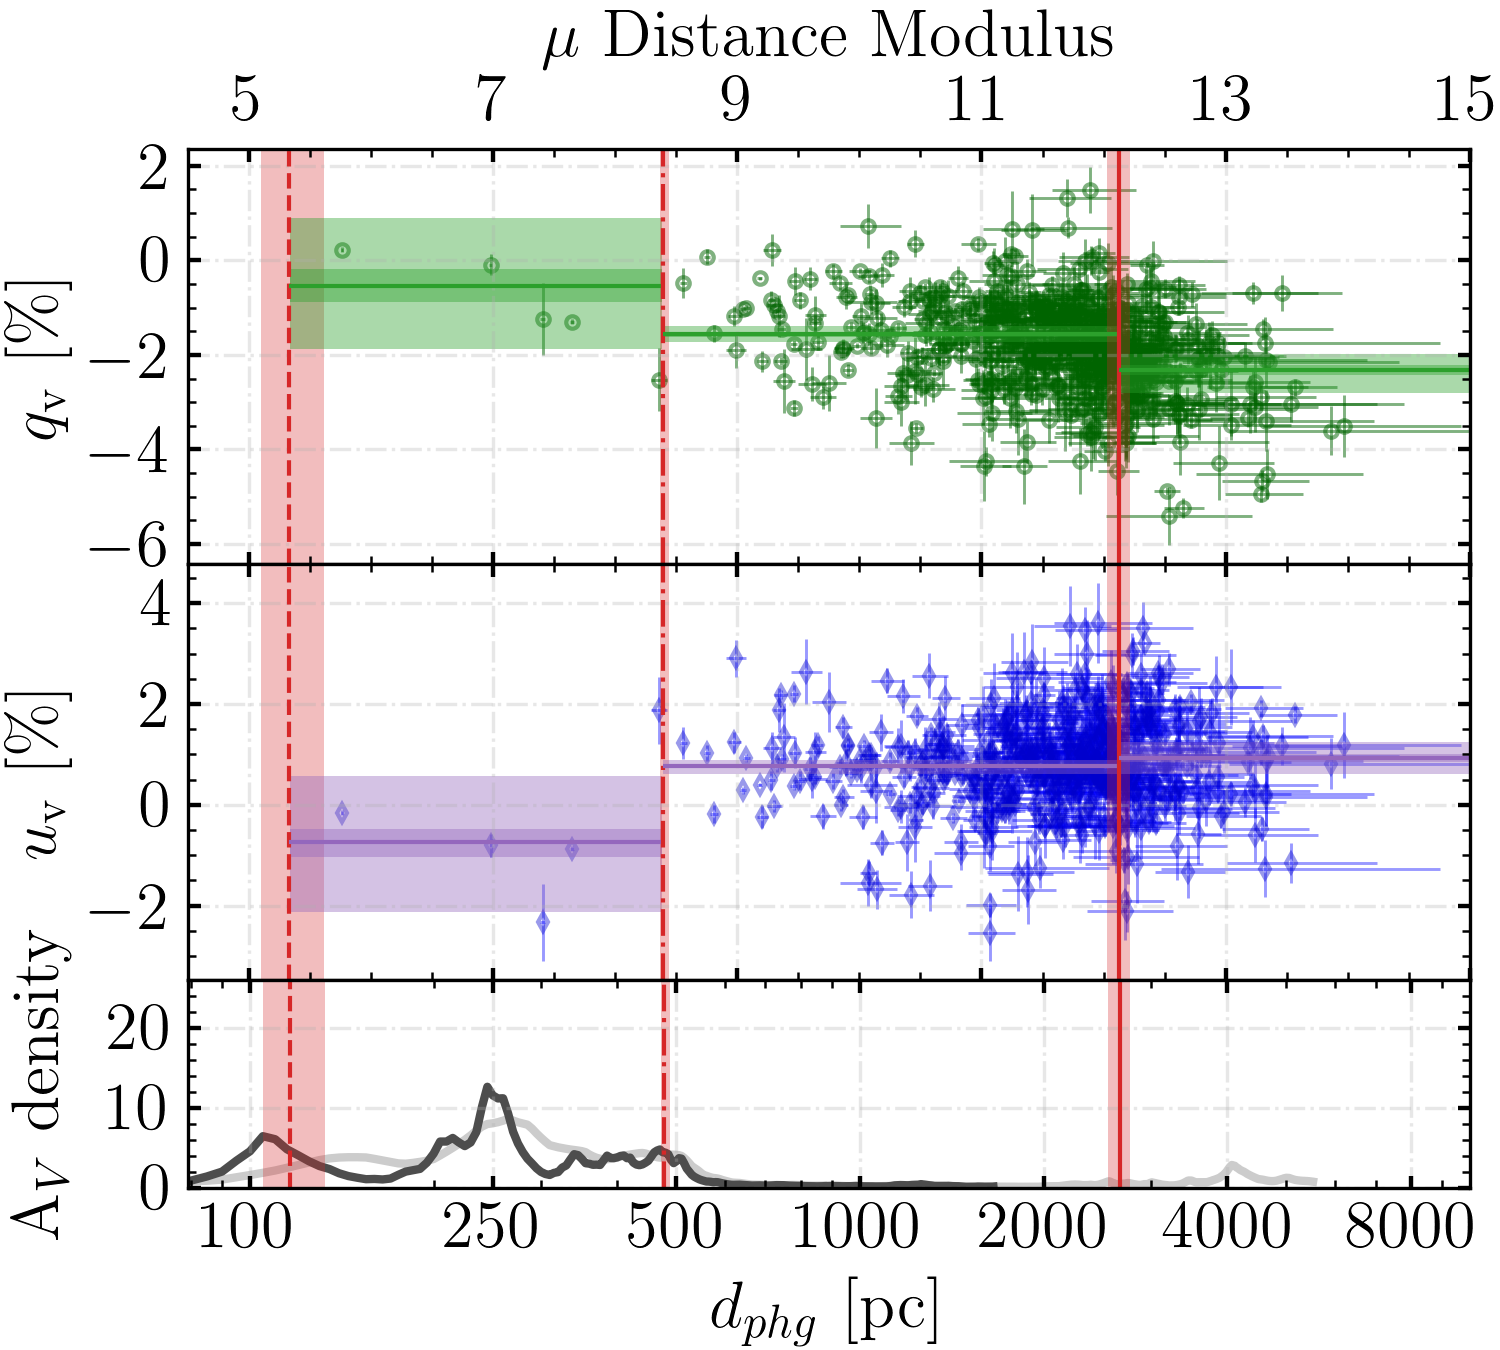
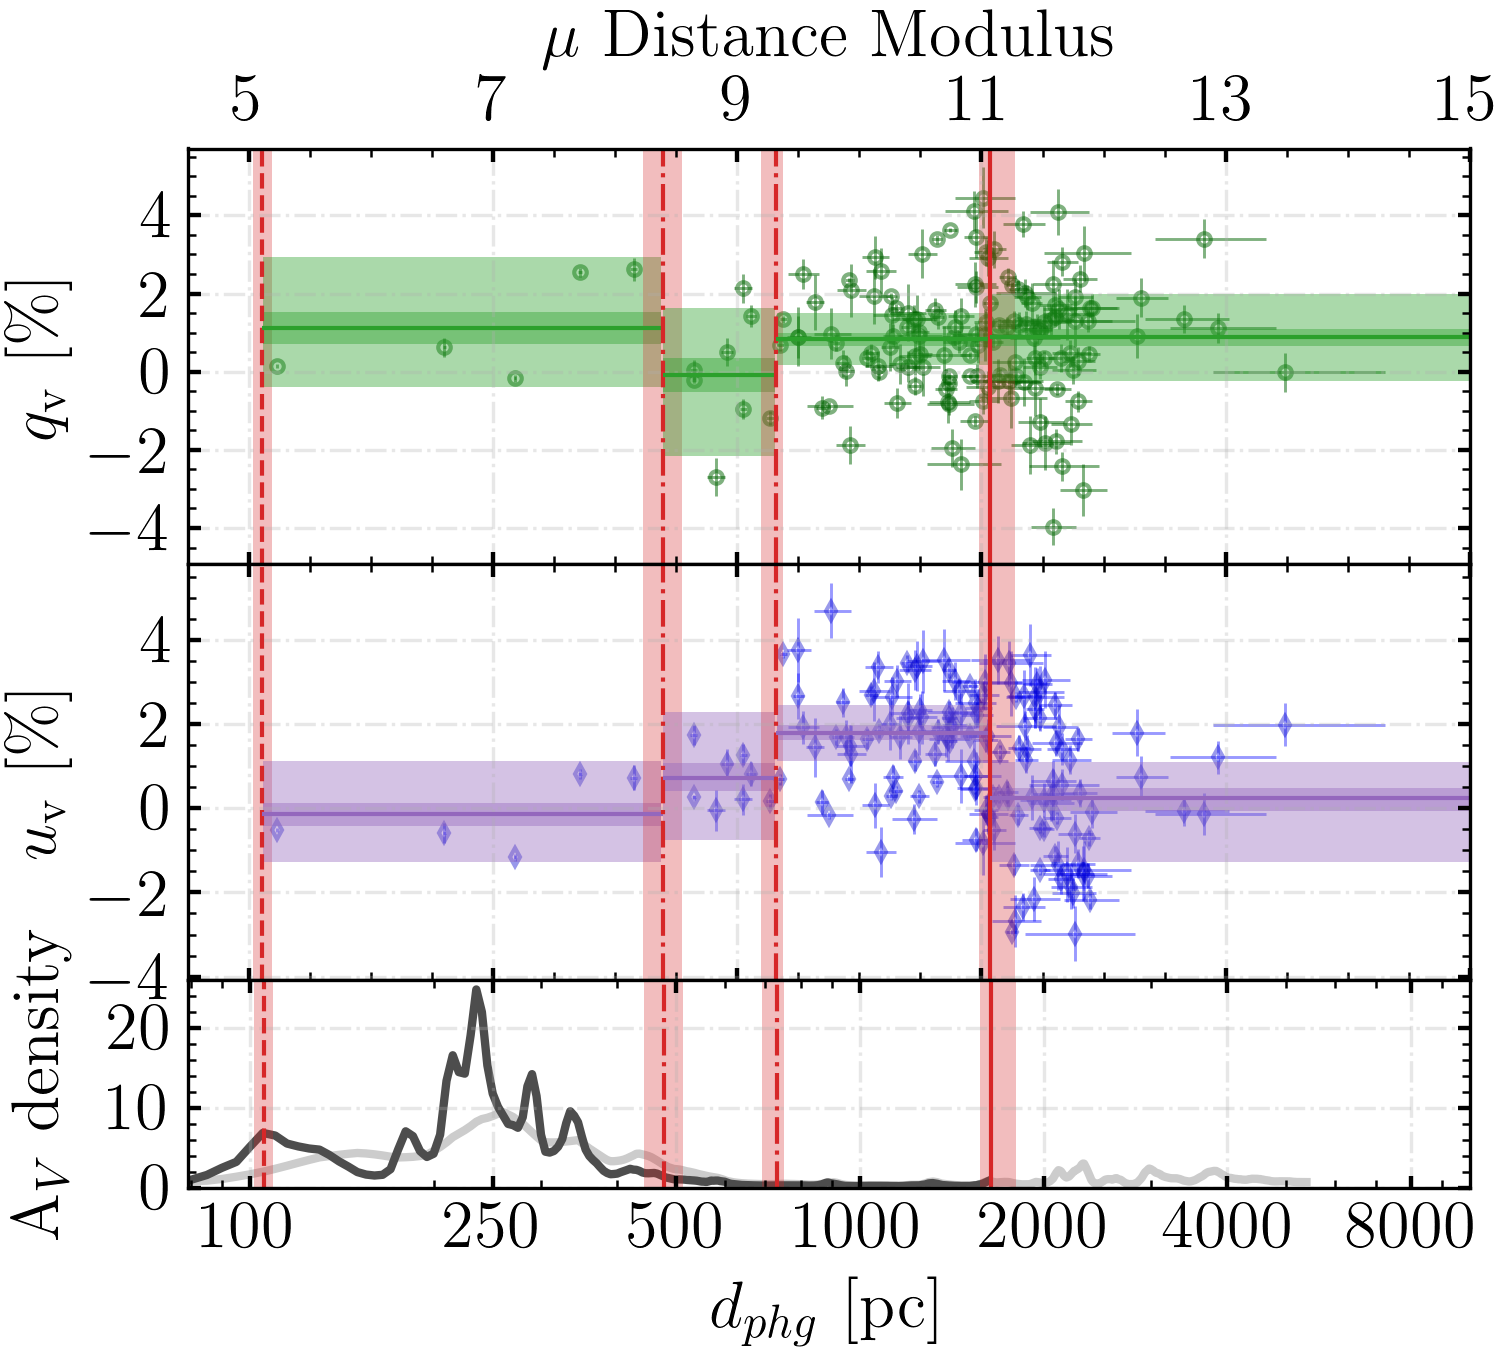
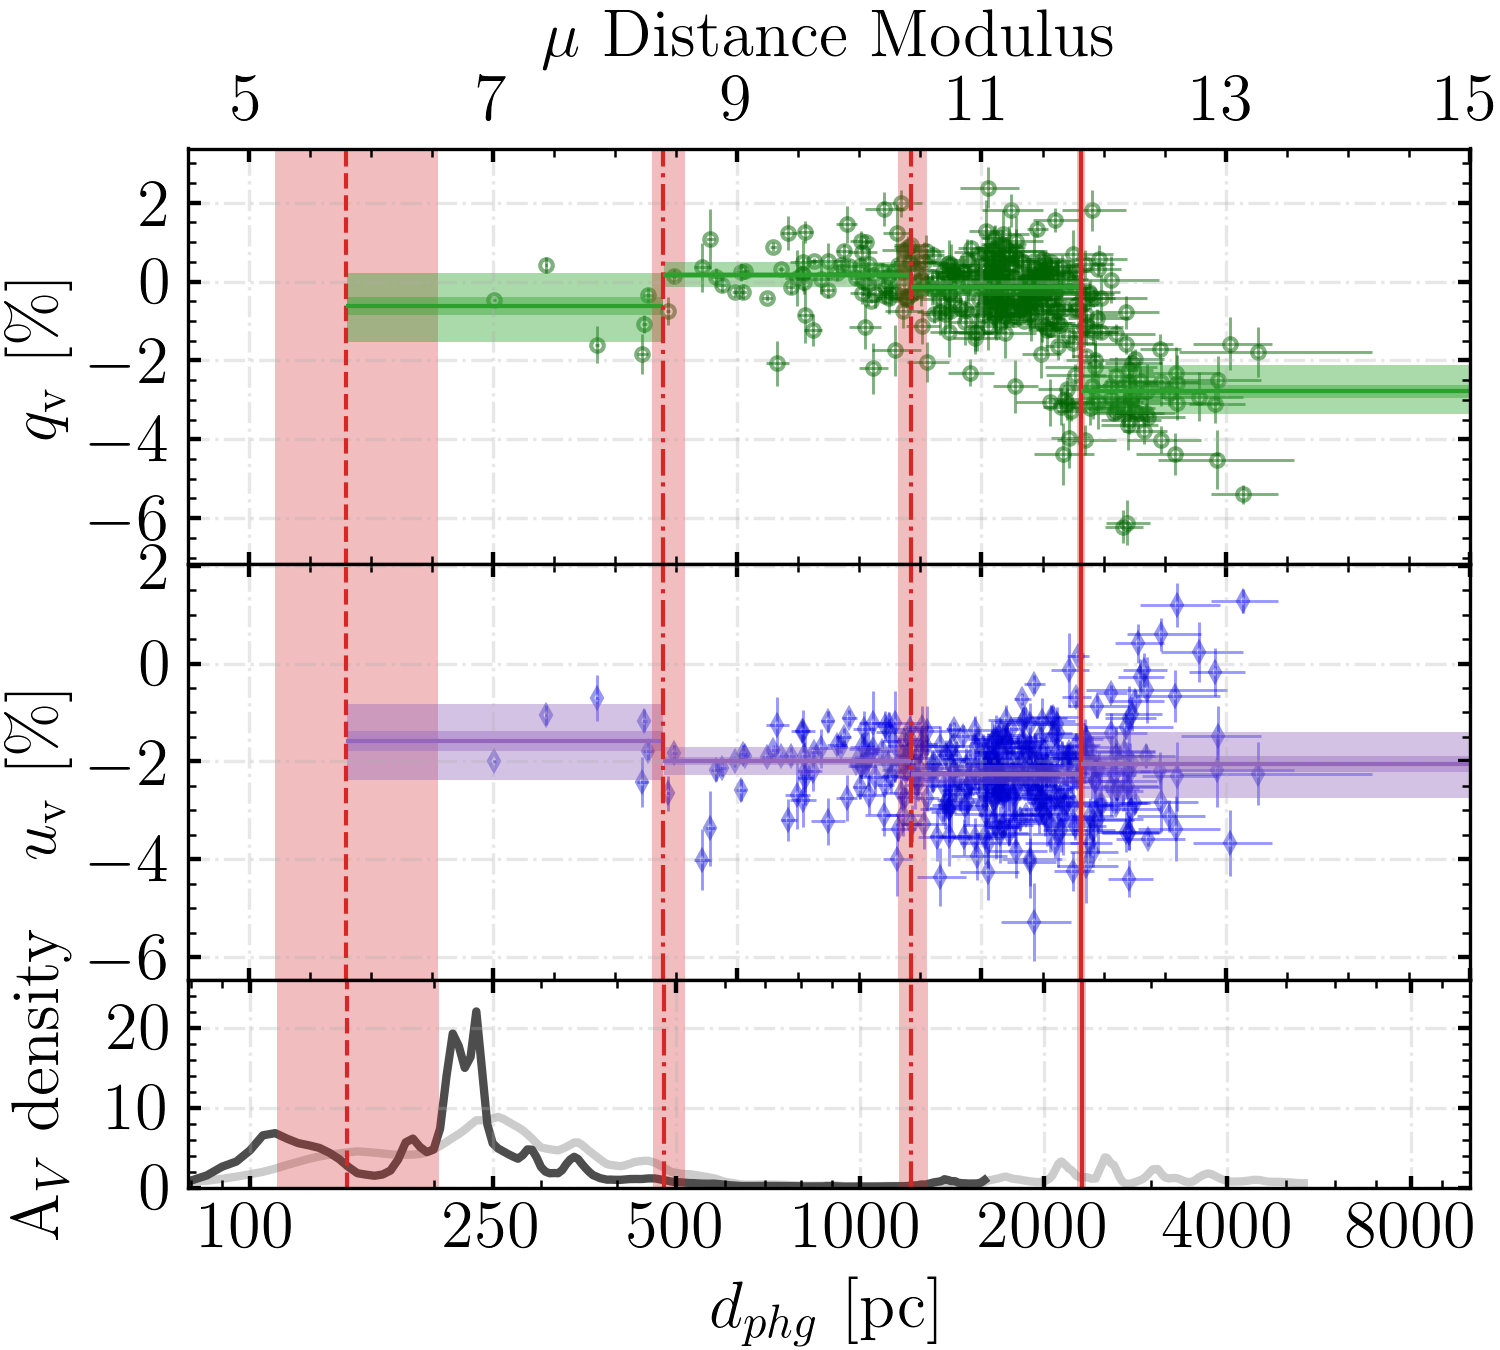
Figure 2: Best solutions of the polarization decomposition using BISP-1 with optical polarization from IPS-GI in the regions of C5 (left), C45 (middle), and C50 (right). The top and middle panels show the Stokes parameters qv and uv as a function of the distance modulus, calculated using the inverse parallax. The red vertical lines and shaded areas represent the modeled clouds’ distances and their 68% confidence interval, 1σ. Similarly, the horizontal solid lines and shaded areas represent the LOS-integrated median qv (green) and uv (purple) and their 1σ and 2σ uncertainties for each group of stars behind the polarizing layers. The bottom panels show the extinction per distance unit profiles from Vergely et al. (2022, the distance is in log scale).
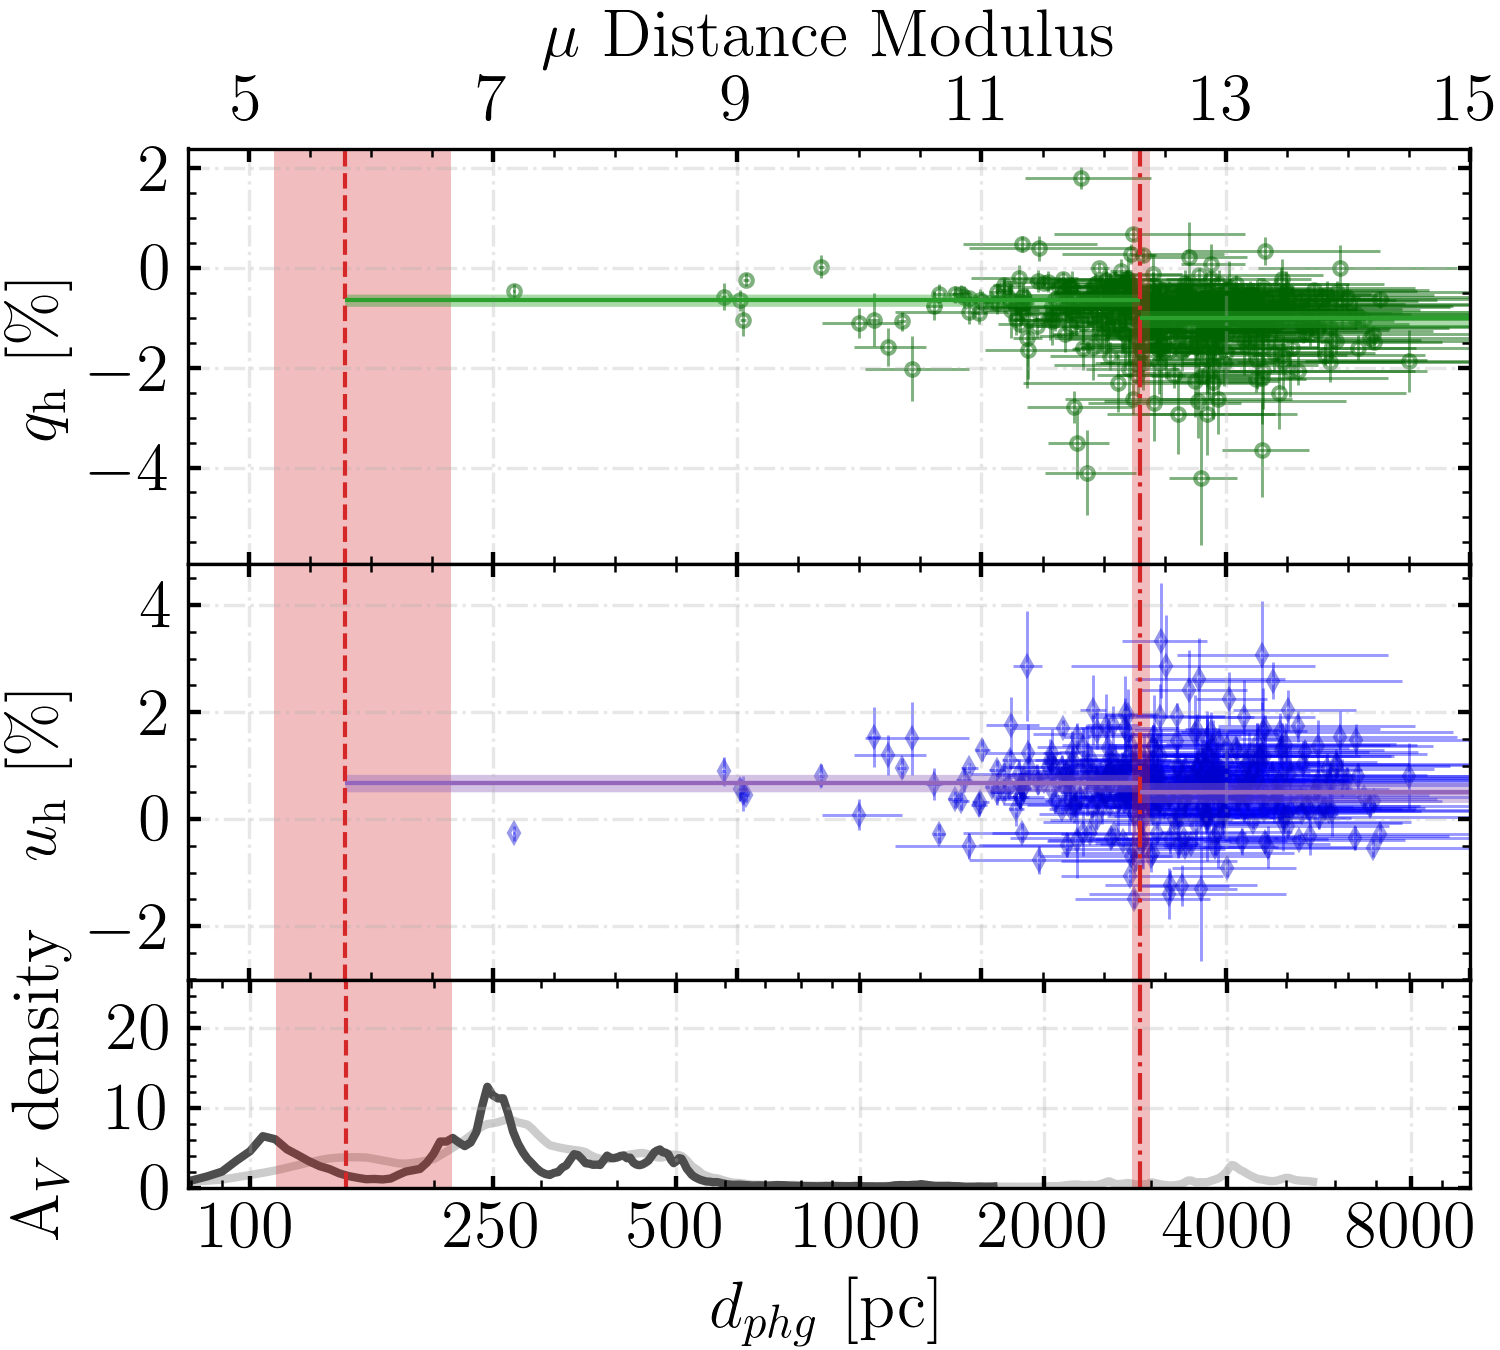
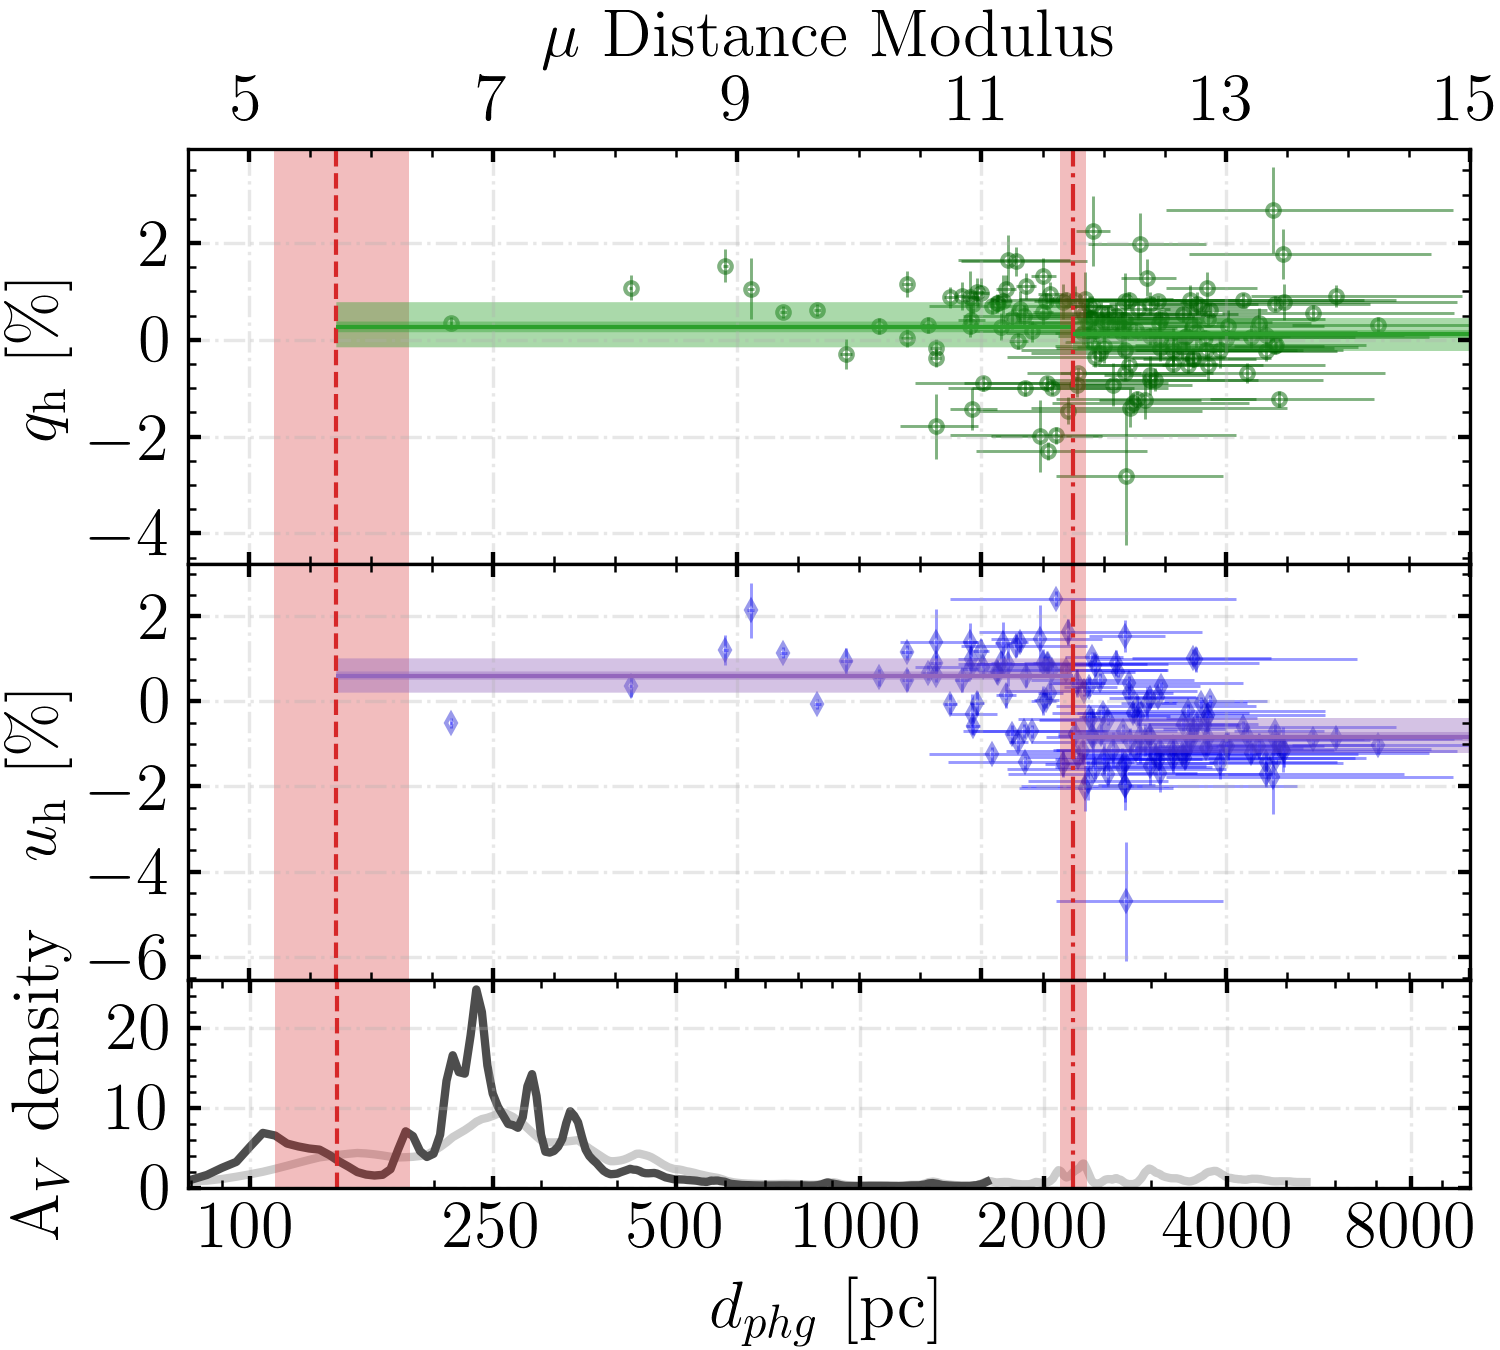
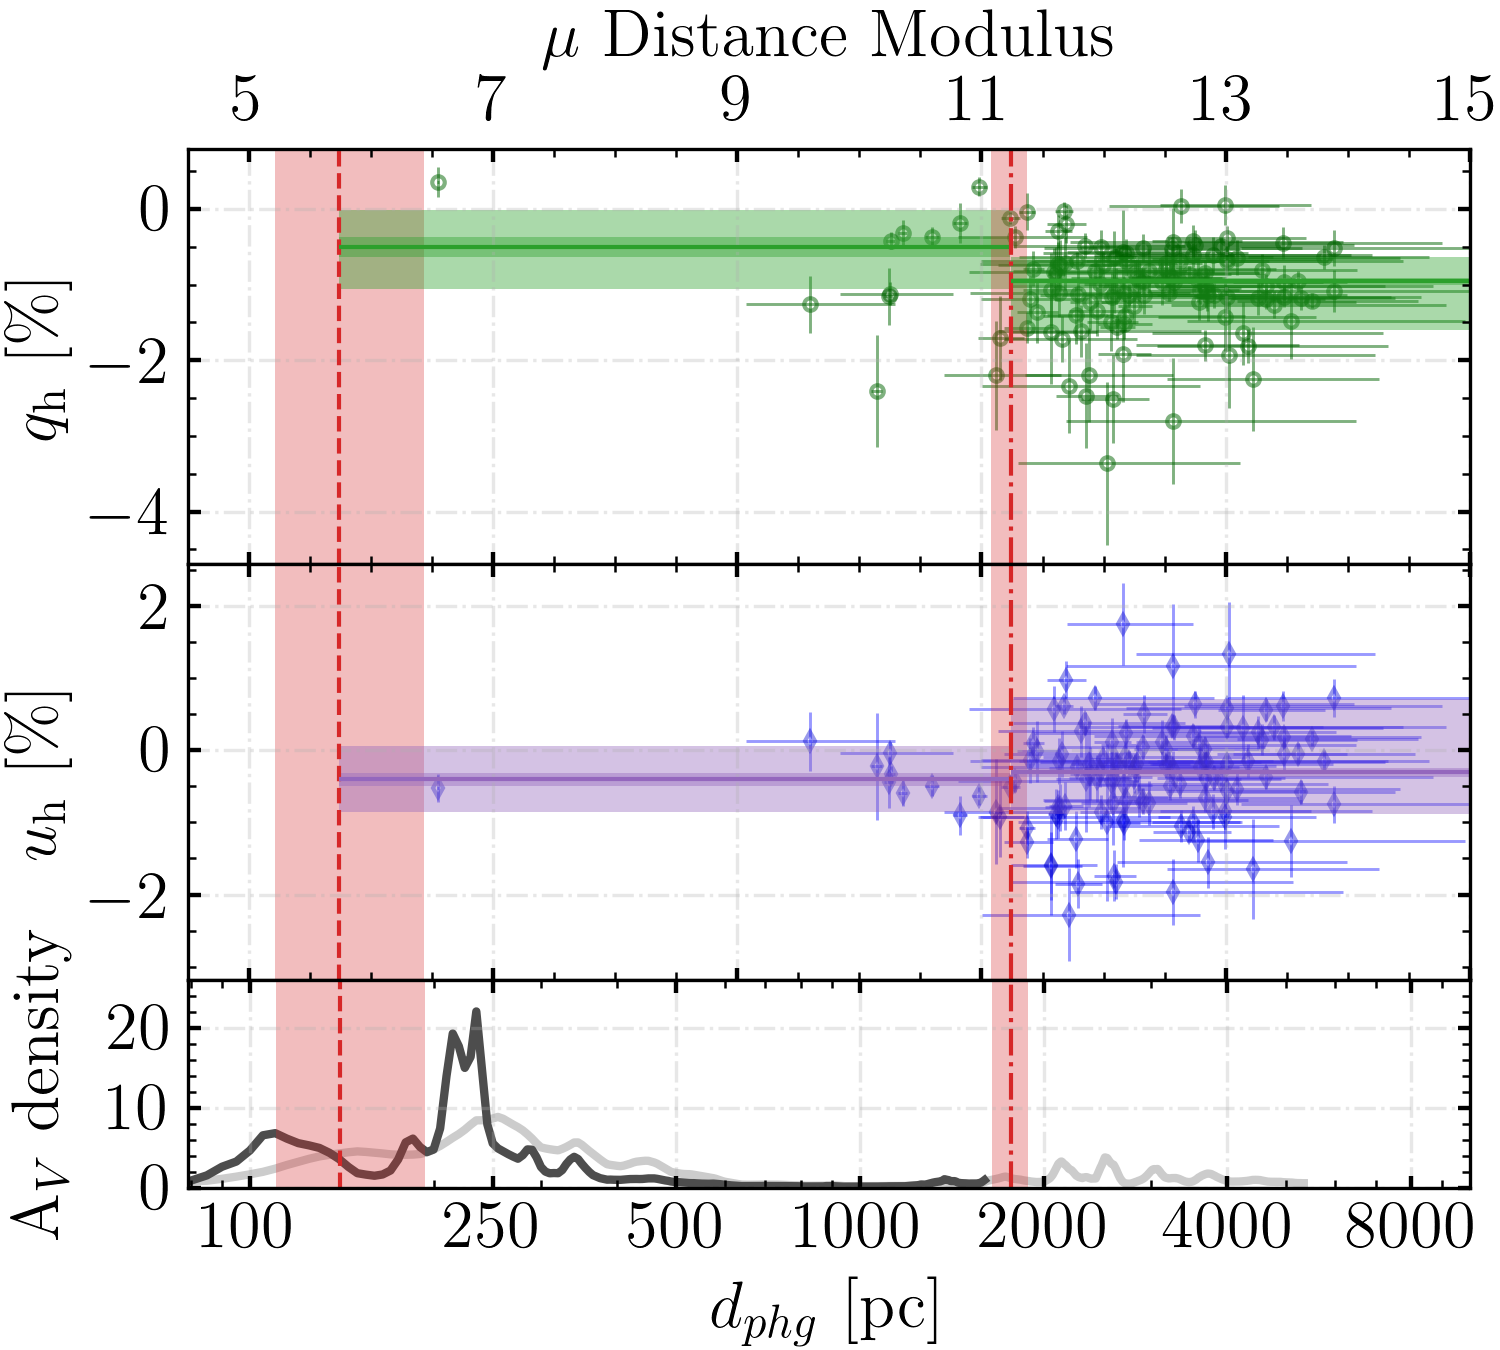
Figure 3: Same as in Figure 2 but using near-infrared polarization from the Galactic Plane Infrared Polarization Survey (GPIPS).